Team Velocity Dashboard
AI-powered command centre for continuous dev cycle optimization and faster, more reliable delivery
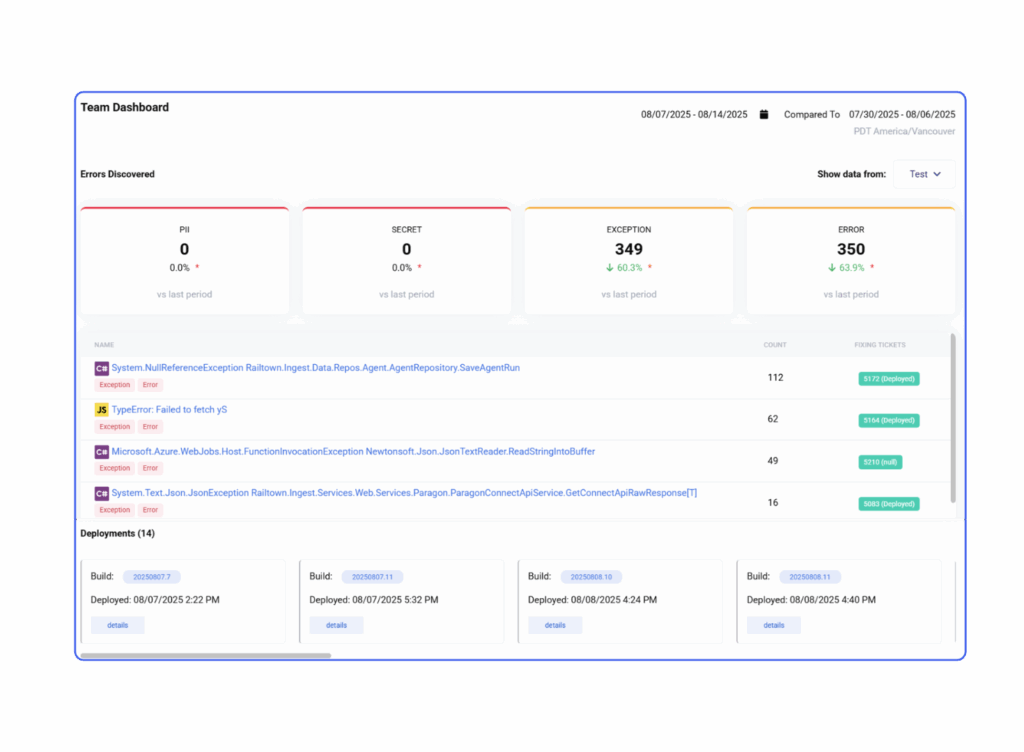
Measure Error Spikes and Deployment Stability
Enables engineering leaders and developers to precisely evaluate application performance by identifying deployments that introduce new errors by visualizing trends week over week to uncover patterns, refine workflows, and accelerate delivery.
Detect Error Spikes
Measure detected issues categorized by PII, infrastructure secrets, and exceptions, grouped by root caus
Measure Deployment Performance
Visualize recent deployments and enable teams to correlate error spikes with release activity
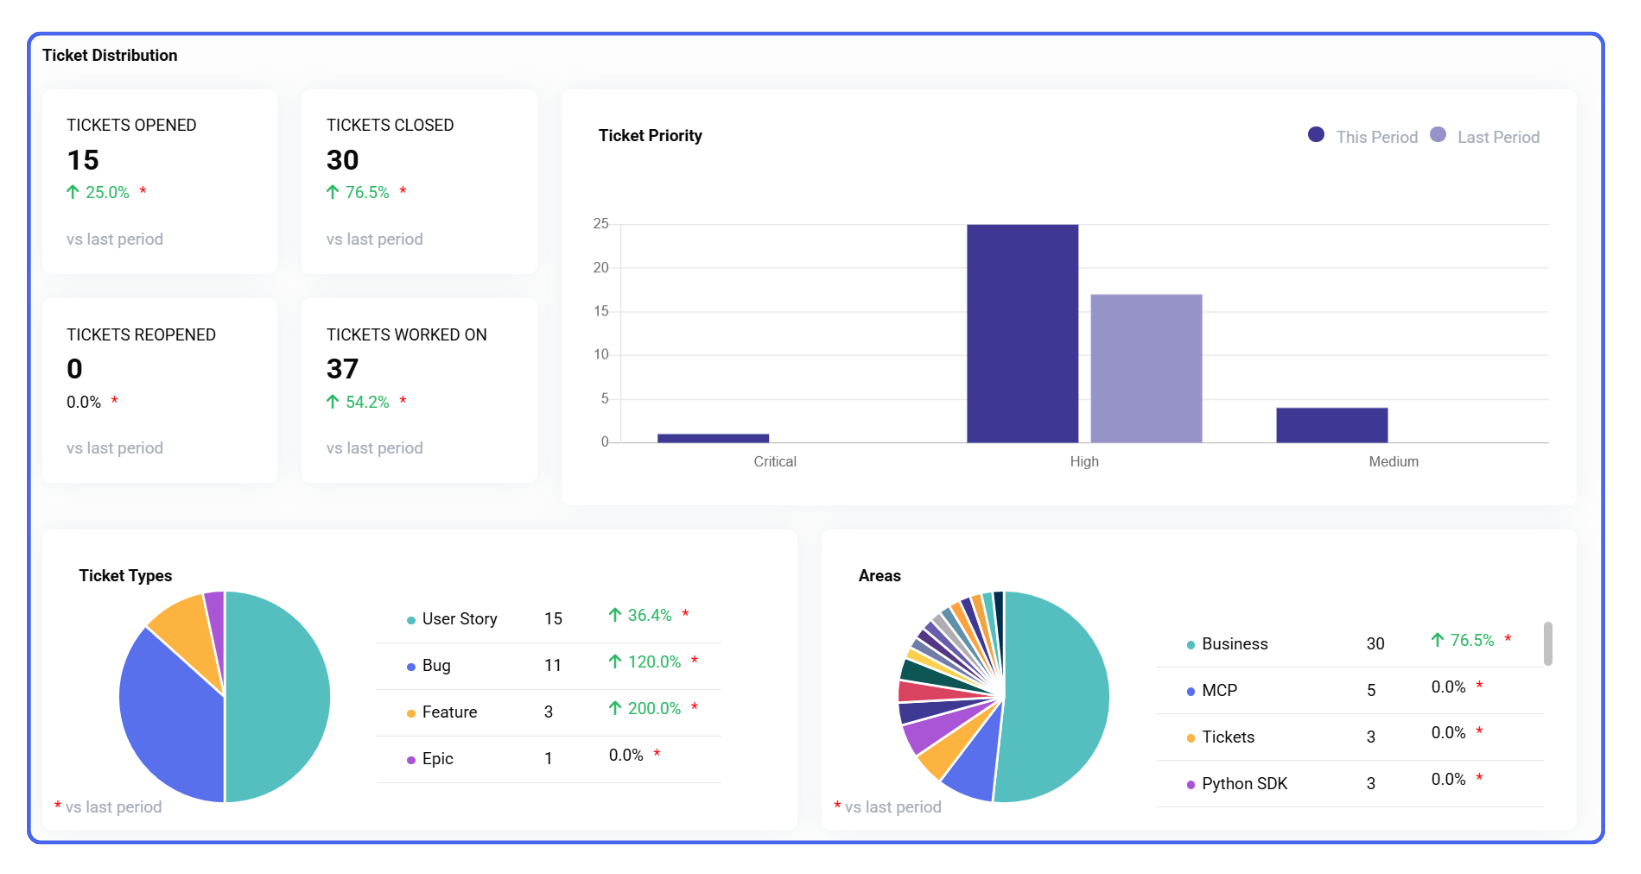
Dev Focus and Delivery Trends
Visualize how your team allocates effort and responds to delivery demands with insights
Understand Development Focus
Understand whether teams are focused on resolving critical issues or progressing on features and epics through charts and bar graphs
Expose Ticket Dynamics
Reveal responsiveness, rework rates, and throughput trends weekly with opened, closed, and reopened tickets stats
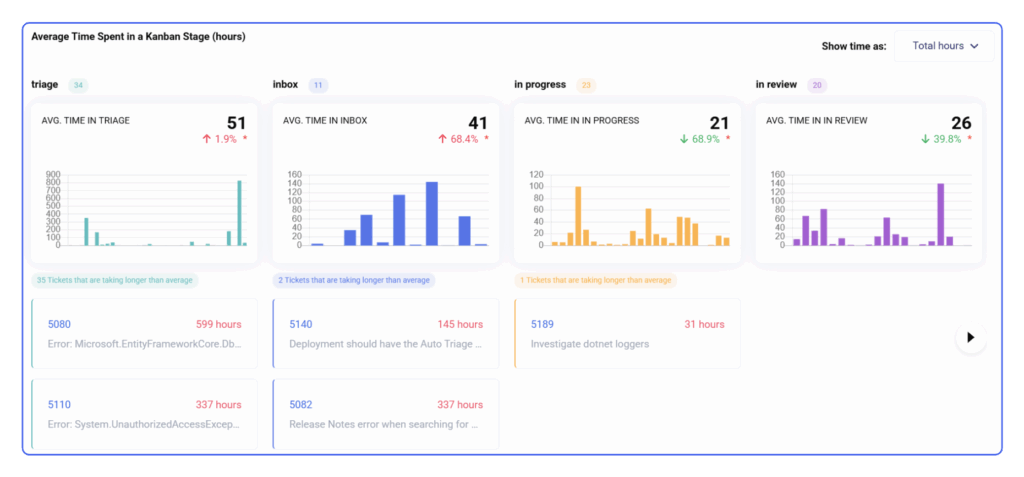
Spot Blockers and Gain Velocity Momentum
Reveals where work slows down by highlighting workflow bottlenecks and compares dev lifecycle and lead times weekly
Flag inefficiencies
Detect stalled or prolonged tickets based on time spent in each dev stage, revealing workflow bottlenecks
Empowers continuous improvement
Compares dev lifecycle and lead times weekly, helping dev teams refine processes and build velocity momentum
Unlock Full Developer Potential
Reflect, recalibrate, and continuously improve by tracking ticket response, surfacing strengths, and revealing where work gets stuck. Start making smarter decisions with real-time insights for free.
FAQs
How can I get started with Conductr today?
Sign up for a demo with our Success Team. They’ll walk you through the functionality and how to connect your data so the Conductr can work it’s magic.
Does Conductr store my application's source code?
Sign up for a demo with our Success Team. They’ll walk you through the functionality and how to connect your data so the Conductr can work it’s magic.
How does Conductr work?
Sign up for a demo with our Success Team. They’ll walk you through the functionality and how to connect your data so the Conductr can work it’s magic.
Is Conductr secure?
Sign up for a demo with our Success Team. They’ll walk you through the functionality and how to connect your data so the Conductr can work it’s magic.
Start a Free Trial
The Developer Dashboard turns dev stats into visual insights that reveal workflow patterns, highlight impact, and help each developer improve. Try it free and unlock smarter decisions.
FAQs
How can I get started with Conductr today?
Sign up for a demo with our Success Team. They’ll walk you through the functionality and how to connect your data so the Conductr can work it’s magic.
Does Conductr store my application's source code?
Sign up for a demo with our Success Team. They’ll walk you through the functionality and how to connect your data so the Conductr can work it’s magic.
How does Conductr work?
Sign up for a demo with our Success Team. They’ll walk you through the functionality and how to connect your data so the Conductr can work it’s magic.
Is Conductr secure?
Sign up for a demo with our Success Team. They’ll walk you through the functionality and how to connect your data so the Conductr can work it’s magic.
Measure Error Spikes and Deployment Stability
Enables engineering leaders and developers to precisely evaluate application performance by identifying deployments that introduce new errors by visualizing trends week over week to uncover patterns, refine workflows, and accelerate delivery.
Detect Error Spikes
Measure detected issues categorized by PII, infrastructure secrets, and exceptions, grouped by root cause
Measure Deployment Performance
Visualize recent deployments and enable teams to correlate error spikes with release activity


Development Focus and Delivery Trends
Visualize how your team allocates effort and responds to delivery demands with insights
Understand Development Focus
Understand whether teams are focused on resolving critical issues or progressing on features and epics through charts and bar graphs
Expose Ticket Dynamics
Reveal responsiveness, rework rates, and throughput trends weekly with opened, closed, and reopened tickets stats
Spot Blockers & Gain Velocity Momentum
Reveals where work slows down by highlighting workflow bottlenecks and compares dev lifecycle and lead times weekly
Flag Inefficiencies
Detect stalled or prolonged tickets based on time spent in each dev stage, revealing workflow bottlenecks
Empower Continuous Improvement
Compares dev lifecycle and lead times weekly, helping dev teams refine processes and build velocity momentum

Start a Free Trial
Visualize team progress and uncover how process improvements impact delivery speed, focus, and responsiveness. Conductr helps engineering leaders and teams translate insights into action
FAQs
How can I get started with Conductr today?
Sign up for a demo with our Success Team. They’ll walk you through the functionality and how to connect your data so the Conductr can work it’s magic.
Does Conductr store my application's source code?
Sign up for a demo with our Success Team. They’ll walk you through the functionality and how to connect your data so the Conductr can work it’s magic.
How does Conductr work?
Sign up for a demo with our Success Team. They’ll walk you through the functionality and how to connect your data so the Conductr can work it’s magic.
Is Conductr secure?
Sign up for a demo with our Success Team. They’ll walk you through the functionality and how to connect your data so the Conductr can work it’s magic.
