Problem: Regressions slip through, Fragmented workflow, Debugging eats up hours, No shared language for agent quality
Agent development moves fast, but evaluation often doesn’t keep up: models can change, tools get updates, and orchestration workflow evolves. Suddenly, agent behaviour shifts in ways that are difficult to track, compare, or explain. Teams end up shipping agents without a reliable way to measure whether they’re actually improving or quietly regressing.
For many developers, evaluation becomes a manual process. Outputs are compared from memory, screenshots get shared in Slack threads, and debugging turns into a long cycle of re-running prompts and tracing behavior across disconnected logs. Questions like “What changed?” or “Why did this break?” can consume hours because there’s no structured way to compare runs or track quality over time.
The challenge becomes even larger as teams grow. One developer may evaluate tool usage, another may focus on task completion, while someone else relies on custom prompts and spreadsheets. Without a shared framework for evaluation, quality becomes subjective and inconsistent across projects and environments.
Most evaluation tooling forces developers into an uncomfortable tradeoff. Lightweight local tools are fast but isolated, while enterprise platforms introduce collaboration at the cost of speed, flexibility, and developer flow. Teams are often forced to rebuild workflows entirely when moving from local experimentation into production-scale collaboration. That transition is where most evaluation systems begin to break down.
Solution: Local-first, Cloud-ready Agent Evaluations
Local Agent Evaluation was designed around a simple idea: developers should be able to evaluate agents as quickly as they build them.
Instead of waiting on external infrastructure or heavyweight evaluation pipelines, developers can run evaluations locally in seconds and immediately iterate on behavior, prompts, and workflows. The experience stays close to development, making evaluation feel like a natural extension of building agents rather than a separate operational process.
Because the workflow is local-first, runs, datasets, prompts, and evaluation data remain on the developer’s machine. Nothing leaves the environment unless the developer intentionally chooses to share it. This creates a faster workflow while reducing operational overhead during experimentation.
The system is also fully customizable. Developers can create evaluators tailored to their own workflows, whether they want to measure:
- Tool usage
- Task success
- Multi-step reasoning
- Response quality
- Agent-specific behaviors
Rather than relying on generic scoring systems, evaluations can reflect the actual objectives of the agent being built. Most importantly, progress becomes measurable. Performance can be tracked across runs with structured metrics and visual comparisons, making regressions visible immediately instead of surfacing later in production.
As projects mature, agent evaluation naturally becomes collaborative. Teams need shared datasets, standardized metrics, review workflows, governance, and visibility across environments.
That’s where Conductr Agent Evaluation extends the workflow. The key difference is that developers don’t need to rebuild their agent evaluation structure when moving from local development into team-wide collaboration. The same schema used locally continues working in cloud-ready workflows without migrations or duplicated setup.
This continuity matters because it removes one of the biggest friction points in scaling agent development. Teams can move from solo experimentation to collaborative evaluation without losing context, restructuring datasets, or redefining metrics.
Conductr centralizes evaluations across projects, environments, and teams while keeping workflows consistent. Developers can share datasets, deep-link evaluation results, compare runs collaboratively, and standardize quality metrics across the organization.
At the organizational level, teams gain:
- Centralized evaluation management
- Shared datasets and review workflows
- Organization-wide analytics
- Auditability and governance
- Managed infrastructure and retention
- Production trend analysis
The experience scales without forcing developers to abandon the workflows they already use locally. That’s the bigger story behind local-first, cloud-ready evaluations: developers can start small, move fast, and scale collaboration naturally without introducing migration pain later.
Why This Approach Sets Devs and Teams Up for Success
Most evaluation platforms are designed for one stage of development, not the entire lifecycle.
Some tools are optimized for individual experimentation but struggle once teams need collaboration and governance. Others are built for enterprise workflows from the start, but introduce too much complexity too early for developers who simply want to iterate quickly.
The result is fragmentation. Local workflows differ from production workflows. Schemas change between environments. Metrics become inconsistent across teams. Evaluation logic gets duplicated as organizations scale.
Conductr approaches the problem differently by treating local development and organizational collaboration as part of the same continuous workflow.
Developers can begin with fast, private evaluations on their own machine and later extend those same evaluations into collaborative cloud workflows without changing the underlying structure. The schema stays consistent from local runs to organization-wide analytics.That consistency creates a smoother path from experimentation to production-scale evaluation.
How Local-first, Cloud-ready Agent Evaluations Works
The workflow is designed to stay simple while scaling naturally with the needs of the developer or team.
1. Run
Developers can evaluate observed runs or datasets directly against evaluators and metrics. Whether testing tool usage, reasoning quality, or task completion, evaluations happen close to the development process so iteration remains fast.
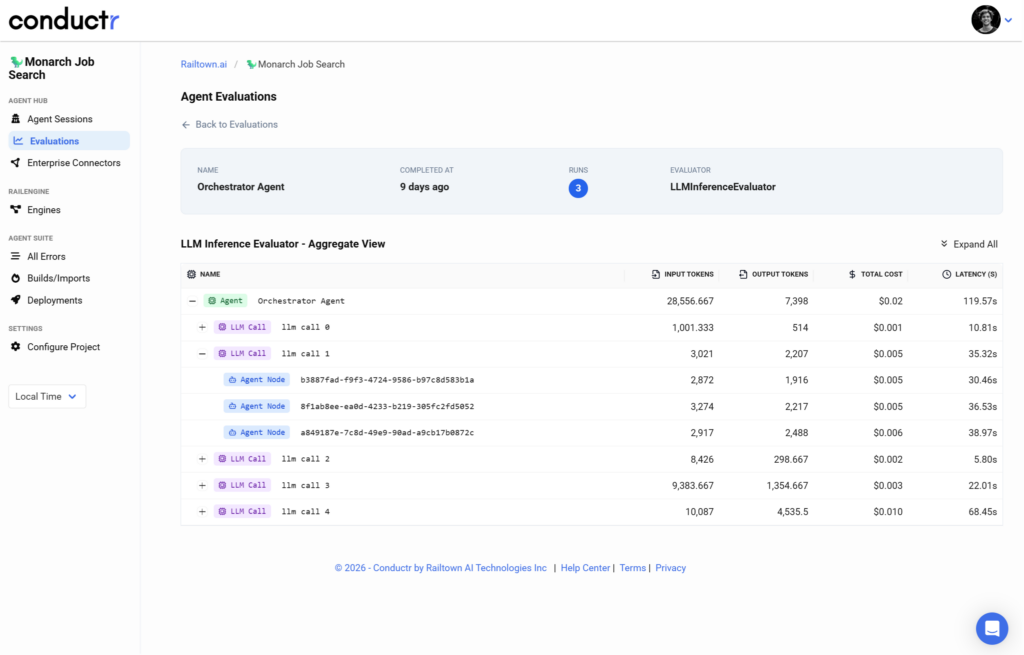
2. Inspect
Results can then be filtered and explored by agent, metric, dataset, or evaluator. Teams can drill into detailed run results to understand exactly where performance shifted and why regressions occurred.
3. Compare
Side-by-side comparisons make it easier to identify behavioral changes across versions, prompts, or workflows. Deep links allow developers and reviewers to share evaluation results directly with teammates for faster debugging and review cycles.
4. Scale
As adoption grows, evaluations can extend into secure team-wide and organization-wide workflows with shared datasets, governance controls, human evaluators, and centralized analytics while preserving the same evaluation structure developers started with locally.
Why Conductr Evaluations
Conductr Evaluations combines fast local workflows with scalable collaboration, allowing teams to maintain continuity as development grows.
The platform includes built-in evaluators for:
Evaluations are also tightly integrated into AgentHub, so developers can work within the same environment where agents already live instead of managing disconnected tooling.
Most importantly, the workflow preserves developer control. Teams can begin privately and locally, then adopt shared infrastructure only when collaboration and governance become necessary. That flexibility allows evaluation workflows to evolve naturally alongside the maturity of the project.
Purpose‑Built Agent Evaluations for Devs, Teams, and Orgs
Solo Developers
Developers who want fast iteration without external dependencies can run evaluations locally, offline, and privately while keeping full ownership of their data and workflows.
Teams Shipping Together
Collaborative teams can standardize metrics, share datasets, compare runs, and review evaluations together through shared workflows and deep-linked results.
Organizations Requiring Governance
Organizations needing centralized visibility can extend evaluations into governed environments with auditability, human evaluators, retention policies, and organization-wide analytics through Conductr Cloud.